
Step by step guide
How to find out how well-calibrated you are
1. Start to express your confidence in numbers
Instead of “it is very likely that she will respond positively and date me” express e.g. “there is about 70 % chance she will respond positively and date me.”
A numerical expression is clear and specific and therefore it will help us measure how well we are working with uncertainty and see if we are being too pessimistic or optimistic.
Confidence can range from 0% (absolute certainty the statement is false) through 50% (equally likely to be true or false, representing zero knowledge about the statement) to 100% (absolute certainty the statement is true).
2. Record your beliefs and confidence levels
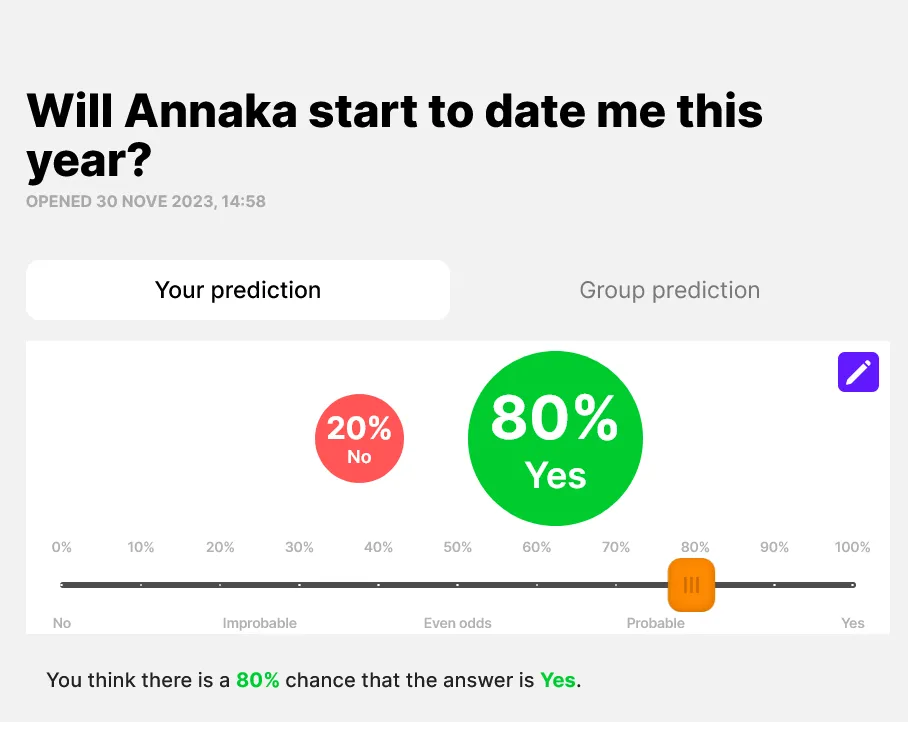
Once you state your confidence in a number, record it. You can use an Excel sheet, paper or the Confido app for it.
You need to record lots of your beliefs to measure your accuracy. (You should ask yourself and record answers to at least 20 questions to have some sense of your approach to uncertainty.)
E.g. “There is 80 % chance I will not be sick next week. There is 90 % chance I will receive the bag I ordered by Friday.”

3. Resolve your questions
Did she really start to date you? Then resolve your uncertain question as “yes.” If she has not, then resolve your uncertain question as “no.”
If you have resolved enough questions (at least 20) and you are using a Confido workspace, a calibration curve will be generated for you automatically.
4. Observe your calibration
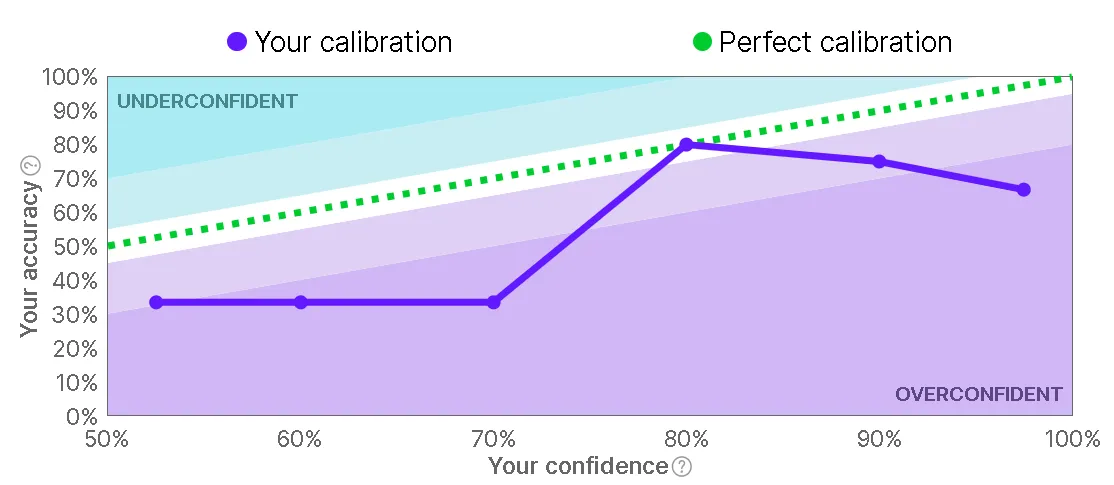
The horizontal x-axis shows you the confidence of your predictions (how sure you felt about different future events). And the vertical y-axis shows you your true accuracy (how often they turned out to be right).
The green dotted line shows you the line of perfect calibration. E.g., if you repeatedly state 80% chance that you’ll be at work before 9:00 a.m. tomorrow, and then you actually get to work before 9:00 eighty out of a hundred times, you’re perfectly calibrated. But that’s rarely the case.
Your personal calibration curve is dark purple on this graph. The more it matches the line of perfect calibration, the better.

5. Update your confidence and make better decisions
Based on your calibration curve, you can be classified as:
- well-calibrated – your dark purple calibration line roughly tracks the green dotted line of perfect calibration;
- overconfident – confidence tends to overstate accuracy, and in Confido the dark purple line of your calibration curve is in the light purple area: you tend to overstate your confidence and claim to know more than you actually do;
- underconfident – confidence tends to understate accuracy, and the dark purple line of your calibration curve is in the light turquoise area: you tend to understate your confidence and claim to know less than you actually do.
Try to update on your findings and measure how well you are calibrated again on a new set of relevant questions.
Advantages of being well-calibrated
Accurate predictions
Calibration involves having a realistic understanding of one’s abilities and making predictions that align with actual outcomes. When individuals are well-calibrated, their predictions are more likely to be accurate, leading to better decision-making.
Effective decision-making
Calibrated individuals are better equipped to assess risks and make informed decisions. They have a clearer understanding of their strengths and weaknesses, allowing them to allocate resources and efforts more effectively.
Learning and improvement
Calibration is closely tied to self-awareness. Well-calibrated individuals can accurately assess their performance, identify areas for improvement, and take meaningful steps to enhance their skills and knowledge.
Building trust
In interpersonal relationships, being well-calibrated fosters trust. When people consistently match their predictions and promises with their actual actions, others are more likely to rely on and trust them.
Adaptability
Well-calibrated individuals are more adaptable. They can adjust their strategies and expectations based on feedback and changing circumstances, making them better equipped to navigate complex situations.
Reduced overconfidence
Overconfidence can lead to poor decision-making and unrealistic expectations. Well-calibrated individuals are less prone to overestimating their abilities, reducing the likelihood of making rash or misguided choices.
Calibration and calibration curves
Frequently asked questions
Everything you need to know about calibration and calibration curves in Confido.
Why is the calibration confidence level in Confido only between 50 % and 100 %?
Confidence is a percentage expressing one’s level of certainty regarding a specific statement (usually a prediction or estimate) that can turn out to be either true or false.
Confidence can range from 0% (absolute certainty the statement is false) through 50% (equally likely to be true or false, representing zero knowledge about the statement) to 100% (absolute certainty the statement is true).
For purposes of calibration, we always consider statements with confidence greater than 50% (“beliefs”).
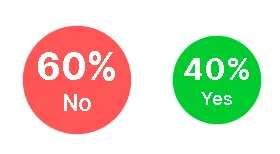
For example, a prediction of 40% on a yes/no question Will we finish the project on time? implies a 40% confidence in the statement We will finish the project on time and a 60% confidence in the statement We will finish the project late.
These confidences always add up to 100% and are basically two ways of talking about the same thing. We will consider only the latter when computing calibration.
Thus the confidence axis ranges only from 50% to 100%. On this range, greater numbers represent more certainty. (This would not be true on the whole 0% to 100% range, as both 0% and 100% represent absolute certainty.)
What is accuracy and confidence bracketing?
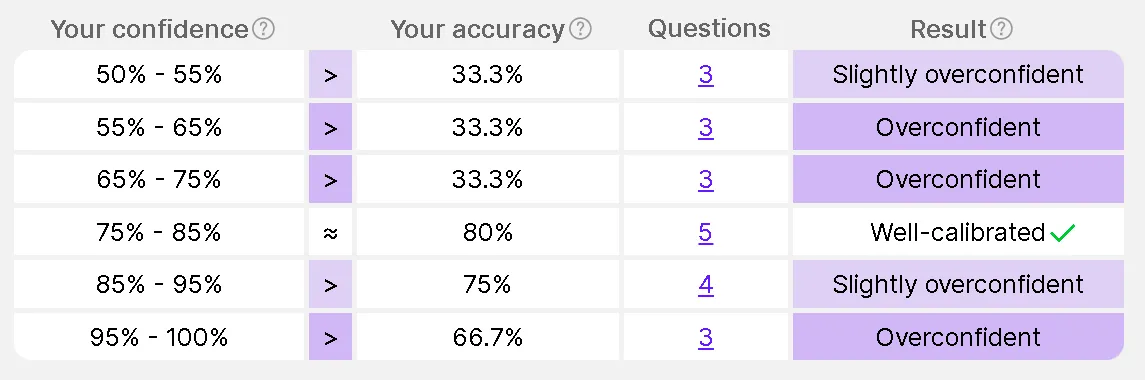
For a given confidence level, your accuracy is simply the proportion of your beliefs with that confidence that turn out to be correct.
For example, if you made 10 predictions at 80% confidence and 7 of them turned out correct, your accuracy would be 70% (making you slightly overconfident).

As accuracy is an average metric, we need to aggregate enough predictions with a given confidence level to get a meaningful result. (For example, if you made only two 80% predictions, one correct, one not, for an accuracy of 50%, it is hard to say whether you are overconfident or just had bad luck.)
To achieve that, instead of computing accuracy separately for each exact confidence level (such as 80%, 81%, or even 80.5%), Confido groups predictions with similar confidence levels into confidence brackets and then computes accuracy for each bracket.
For example, the 80% bracket contains all predictions with confidence in the range from 75% to 85%. If you made four predictions with confidence levels 78%, 80%, 80%, 84% and three of them were correct, your accuracy in the 80% bracket would be 75%.
(This makes the result less precise because of mixing beliefs with different confidence levels, but this is compensated by averaging more predictions when computing accuracy, thus reducing effects of random chance.)
What does it mean to be well-calibrated, overconfident and underconfident?
Based on your results, your calibration in a given bracket can be classified as:
- Well-calibrated when your confidence tends to roughly match your accuracy. In that case, your confidence can be used as an indicator of how likely you are to be right for predictions where the answer is not yet known. This is what you strive for.
- Overconfident if your confidence tends to be larger than the resulting accuracy, i.e. you tend to be more strongly convinced of your beliefs than is warranted. Thus other people (and probably even you yourself) should take them with a grain of salt. Most people on Earth start out overconfident, so if that includes you, don’t worry about it too much. There is a lot of room for improvement.
- Underconfident in the much rarer opposite case when you tend to understate your confidence, claim to know less than you actually do.
It is important to note that well-calibratedness, overconfidence and underconfidence are a spectrum. There is no sharp boundary between being well-calibrated and over-/under-confident.
Confido classifies your calibration into several discrete categories (well calibrated, slightly overconfident, overconfident, …) but these are artificial and purely for easier visual orientation and color coding. The boundaries between these categories should not be taken very seriously.
What do I have to do to see my score?
In order for a prediction to be included in calibration computation, several conditions must hold:
- You must have made at least one prediction on the question. By default, your latest prediction is used.
- If the question has a score time set in its schedule, you must have predicted before it (the last update made before the score time is used for purposes of calibration and further updates are ignored).
- The question must have a resolution and be marked as resolved.
A score time is optional. It can be set by the question author or another moderator, either when creating the question or later when resolving it, typically when the answer became obvious before the question was closed. It should be set based on a compromise between the forecasters having enough time to think about the question and the answer not yet being too obvious.
What about numeric/date questions?
Computing calibration requires converting your predictions into belief + confidence pairs, where the beliefs can be later judged as either correct or incorrect.
This is simple for yes/no questions. (We just take whichever of the two possible outcomes you consider more likely, plus the probability you assigned to that outcome.)
But for numeric questions, the situation is a bit more complicated, as there are basically infinitely many possible outcomes.
To address this, Confido converts each numeric prediction into multiple beliefs based on its confidence intervals.
For example, consider a numeric prediction like this:
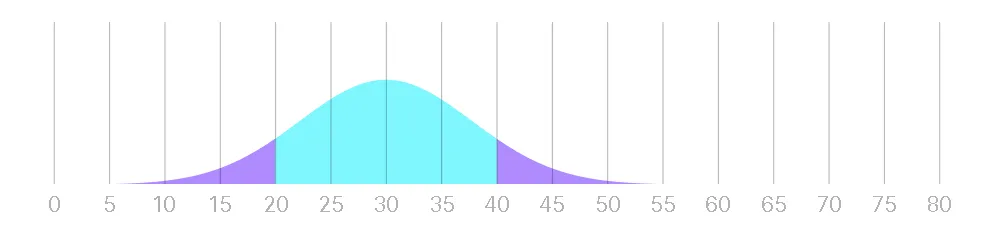
From such a prediction (probability distribution), Confido derives one belief based on a confidence interval for each confidence bracket:
| Bracket | Confidence | Conf. int. | Belief |
|---|---|---|---|
| 50% – 55% | 52.5% | 24.4 to 35.6 | Answer is between 24.4 and 35.6 |
| 55% – 65% | 60.0% | 23.4 to 36.6 | Answer is between 23.4 and 36.6 |
| 65% – 75% | 70.0% | 21.9 to 38.1 | Answer is between 21.9 and 38.1 |
| 75% – 85% | 80.0% | 20.0 to 40.0 | Answer is between 20.0 and 40.0 |
| 85% – 95% | 90.0% | 17.2 to 42.8 | Answer is between 17.2 and 42.8 |
| 95% – 100% | 97.5% | 12.5 to 47.5 | Answer is between 12.5 and 47.5 |
The confidences are chosen as the midpoints of each bracket. The 80% confidence interval (bolded in the table) is what you enter when creating a prediction, the others are mathematically derived from the probability distribution.
Thus a single prediction is converted into 6 belief + confidence pairs (one in each confidence bracket), which are then each considered separately for purposes of calibration, as if you had made 6 separate yes/no predictions.
What is group calibration?
Apart from your individual calibration, Confido can also compute group calibration. But it is important to clarify what that means.
Group calibration is calibration computed based on the group prediction, i.e. calibration of a hypothetical individual whose predictions were equal to the group prediction for each question.
Group prediction is the average of all the individual predictions on a given question. For yes/no questions, it is simply the average of everyone’s confidences.
For numeric/date questions, we are averaging probability distributions, which is beyond the scope of this explanation.
In either case, you can see the group prediction (if you have permissions to view it) on the Group prediction tab of each question.
It is important to note that group calibration is not an average of the individual calibrations.