
That’s why we built Confido, an app for expressing uncertainty in the language of probability, for individual and group calibration, and for forecasting. What sets it apart from other forecasting tools is how intuitive and visual it is.
We’ve previously released Confido 1.0 and Confido 2.0. Since then, we’ve worked with organizations focused on nuclear risk, where most people aren’t familiar with Tetlock-style forecasting. Based on that collaboration, we’ve improved Confido again, and it remains freely available.
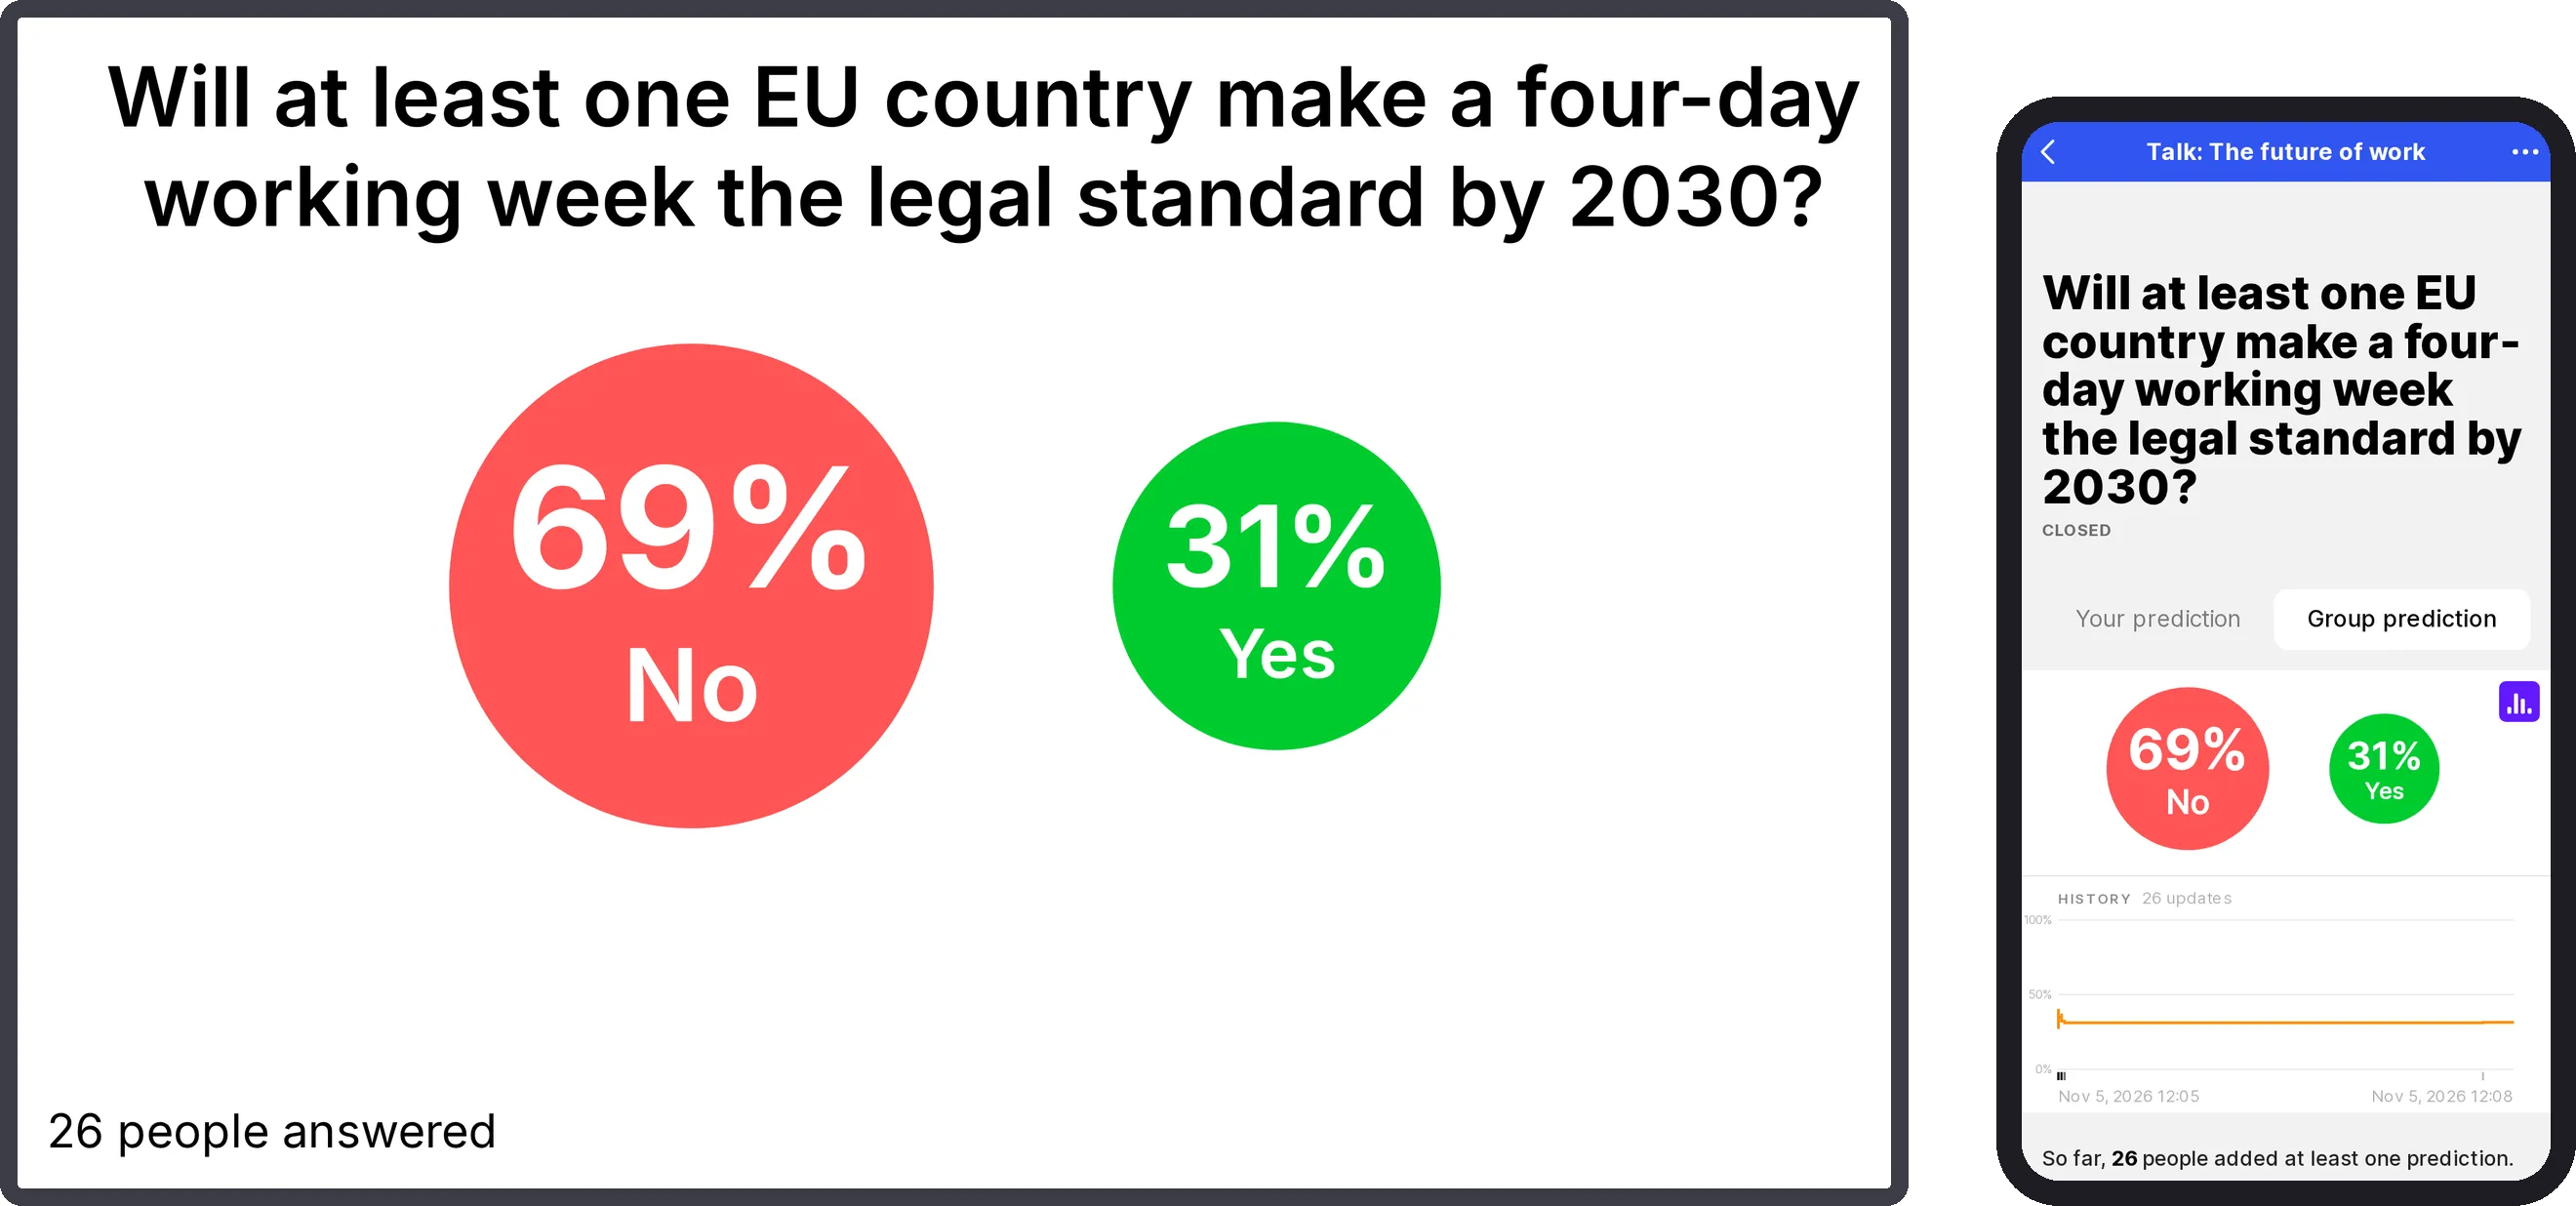
- Interactive talks, workshops and retreats: You can now upload your slides and use Confido to run sessions where groups estimate things together. Between slides, you can project an automatically generated QR code along with your questions, and your audience submits estimates through a simple, intuitive interface. Later in the presentation, you can show the wisdom of the crowd: a histogram of responses, how people updated their views during the talk, and more.
- Small probabilities, trends and calibration: Confido now handles very small probabilities, shows how predictions change over time, and includes built-in calibration training, so individuals and groups can calibrate in the same interface before forecasting real questions.
- Better scoring and analytics: We’ve improved scoring and statistical summaries, making it even easier to run forecasting tournaments. New interactive charts compare group estimates before and after a discussion, or across any points in time.
All screenshots below come from a small demo workspace. Where a feature takes a little more explanation, there’s a collapsible “How to use it” underneath. You can also try the demo or request a free workspace.
New feature 1
Presentations, for meetings that end with numbers
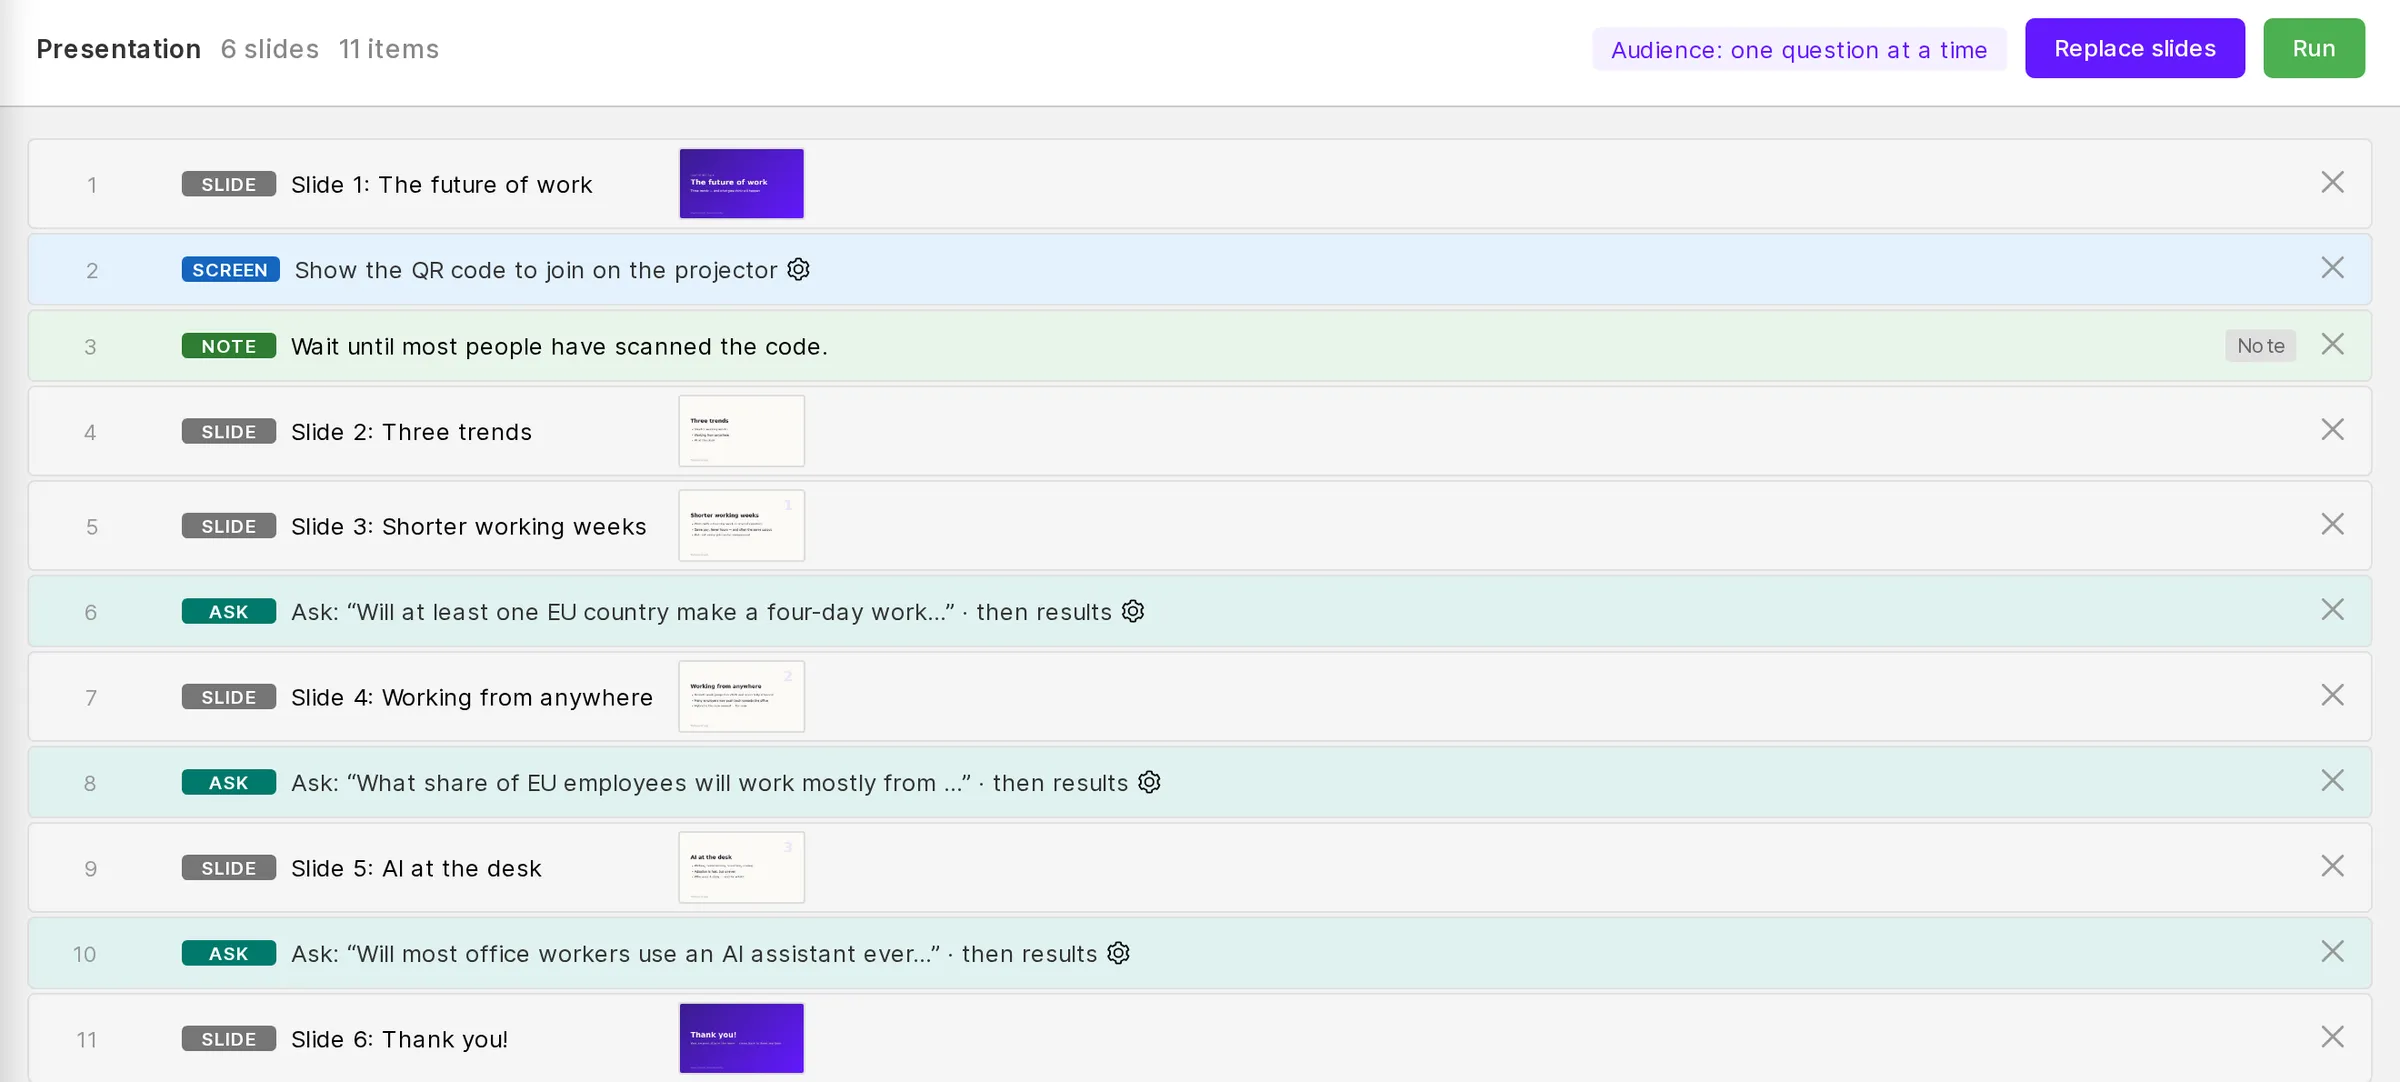
Confido has long had a projector view, but it has now grown into a full meeting tool: a room can hold a presentation, which is an ordered flow of steps that mixes slides (imported from a PDF or a Google Slides deck), presenter notes, projector views, and live actions that let you interact with the audience at exactly the moment you want to.
These actions include sharing a QR code on the screen so that people can join the room from their phones, opening binary or numeric range questions so that the audience can give their best guess or estimate, and revealing the group’s answer once everyone has responded, either as an average answer of your audience, as the full list of individual answers, or as a histogram. You can also drop a timeline marker at any point in the presentation, which makes it possible to compare the group’s estimates before and after a given part of your talk or workshop, and thereby show the audience how their beliefs updated as the session went on. For instance, ask the room “Will AGI arrive before 2030?” at the start of a talk, present your arguments, ask again at the end, and show how the distribution moved.
This mode can be useful for creating your own interactive calibration exercises.
How to use it
- Moderators: room “…” menu → Create presentation creates one; the Presentation tab edits it.
- Run starts the presentation; the projector icon in the top-right of most graphs sends that view to the presenter window at any time, presentation or not.
- Slides: Upload slides accepts a PDF or a public Google Slides link; slide steps are added automatically and titles are extracted heuristically.
- Followers: while a presentation runs, room members get a Follow offer — their browser then navigates along with the presenter, so remote participants see the right question at the right time and can answer it immediately.
- The timeline and comparison views are available as projector views too — including “compare against the marker we dropped last meeting”.
We know that creating your first presentation in Confido can be technically challenging, so if you get stuck while building one, we are happy to help with one free consultation. Please note that only one consultation is free of charge.
New feature 2
Anonymity, from open names to aggregate-only
Sometimes honest forecasts need distance from the forecaster — “will we hit the Q4 plan?” gets different answers when the boss can read names. Each room now has an attribution policy with four levels:
- Open — everyone participates under their own name.
- Pseudonymous — every member gets a stable alias per room (“Swift Badger”), so discussion threads and repeated answers stay coherent without revealing who is who.
- Anonymous — no attribution at all, and no linkage between answers.
- Aggregate only — individual answers are never shown to anyone, in any form; only the group aggregate is, and only once at least five people have answered.
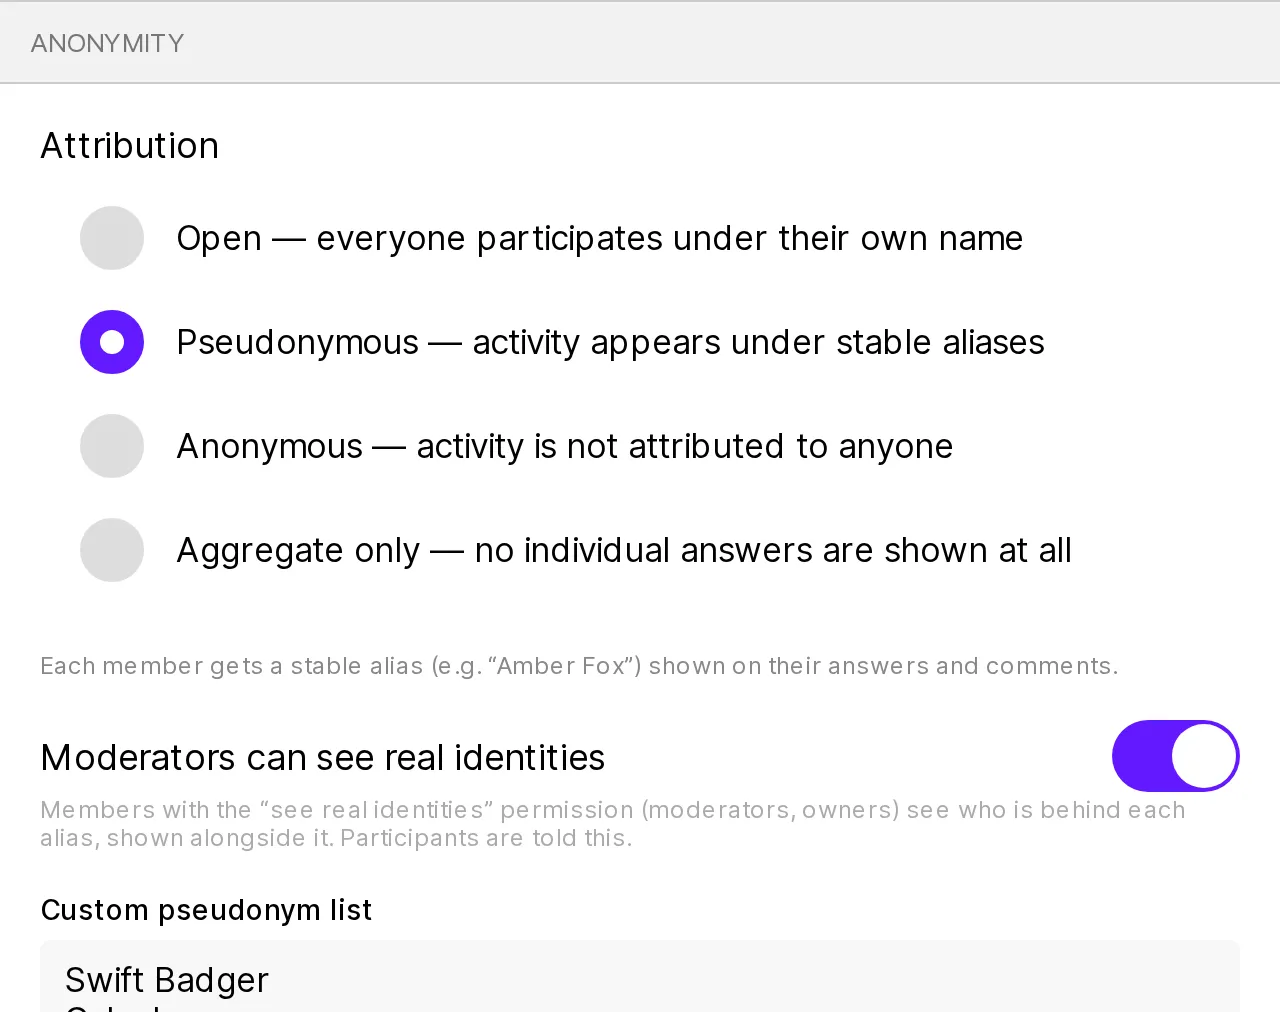
Two properties are worth knowing about. First, the setting is a promise, not a preference: once people have answered or commented under some level of anonymity, the room can’t be quietly reopened — loosening is only possible where nothing was contributed under the stricter promise. Second, moderator visibility is explicit: rooms can let moderators see real identities (shown as a small annotation next to the alias, and participants are told), or be sealed so that nobody can.
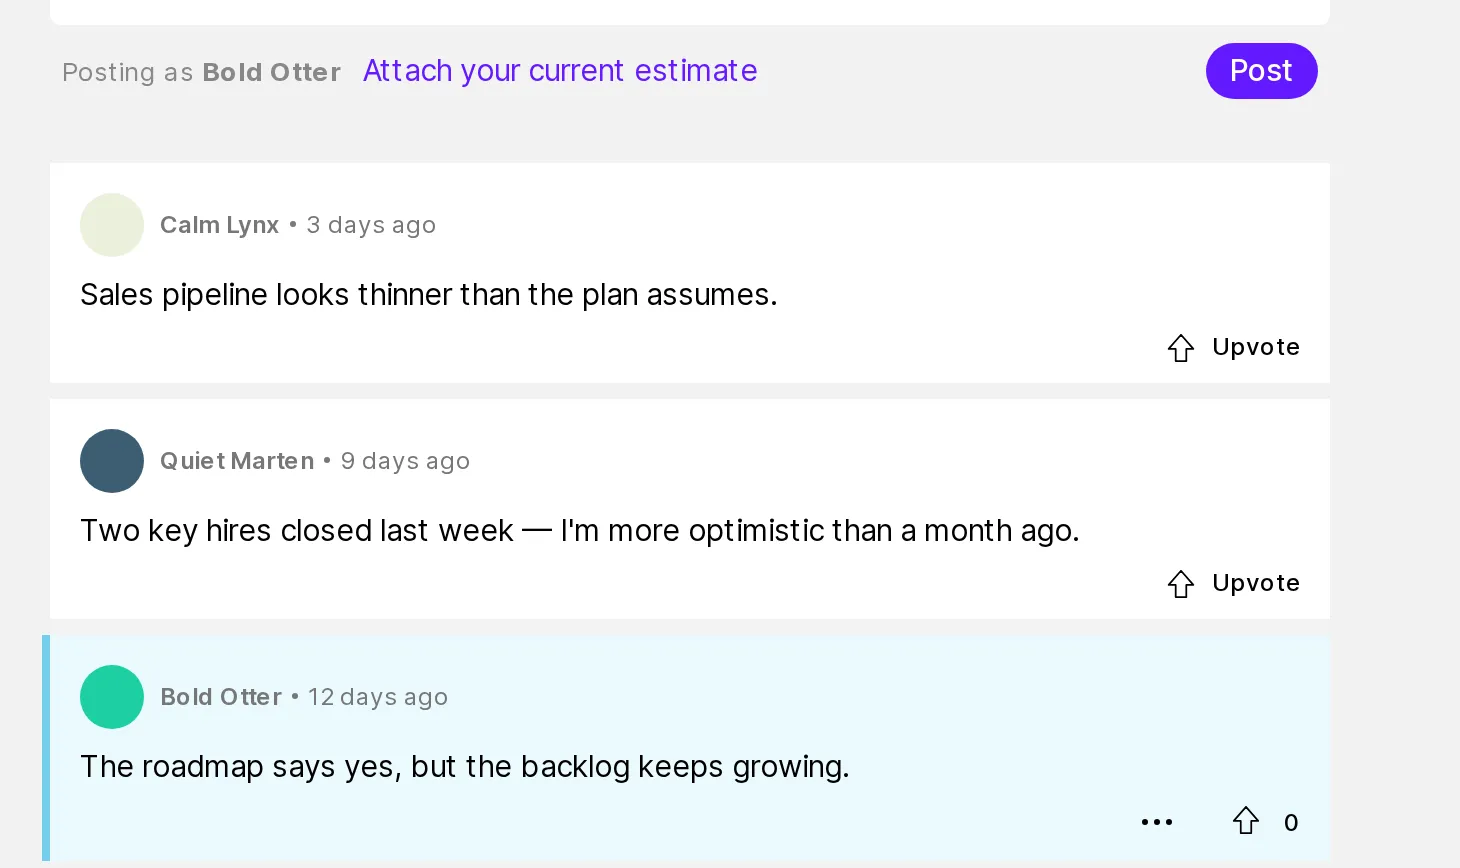
This is what a pseudonymous discussion looks like — everyone keeps a stable voice, and you’re always told how you appear (the “Posting as …” cue above the comment box).
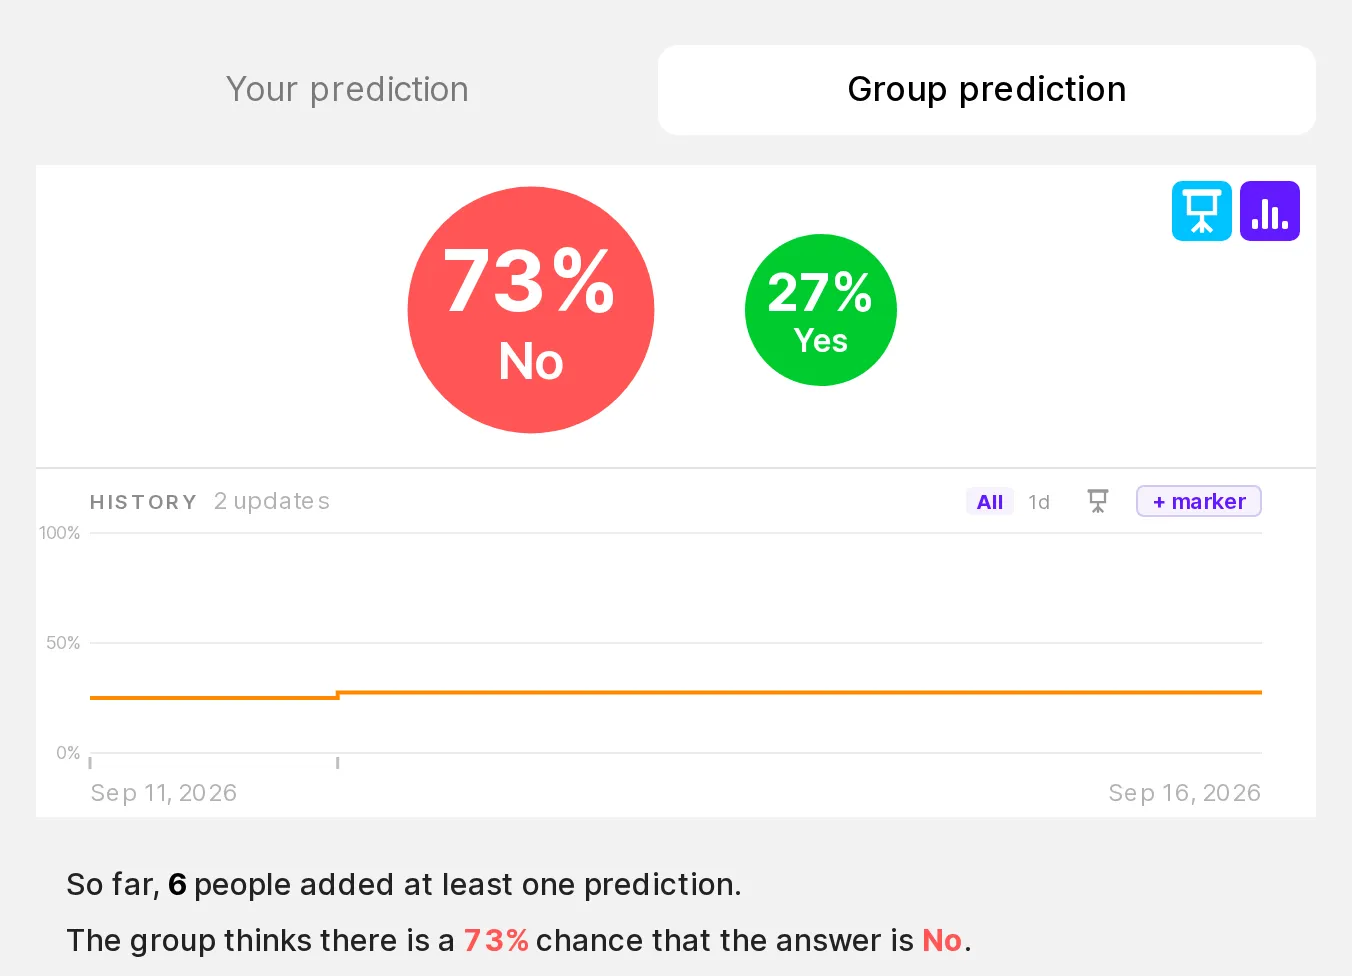
On aggregate-only questions even the history respects the promise: the timeline only starts once enough people have answered, and numeric aggregates are shown as a summary rather than a detailed curve that could give individual answers away. CSV exports follow the same rules as the screen.
How to use it
- Room-wide default: room settings → Anonymity. Per-question override: the question’s edit dialog (Custom attribution) — a question can be stricter than its room, never looser.
- Pseudonyms come from a built-in list; you can supply your own via Configure a custom pseudonym list in the same section. Aliases never change on their own; owners can explicitly re-draw all of them.
- In a room group, child rooms inherit the group’s default policy unless they set their own stricter one.
New feature 3
Expressing very small (and very large) probabilities with precision
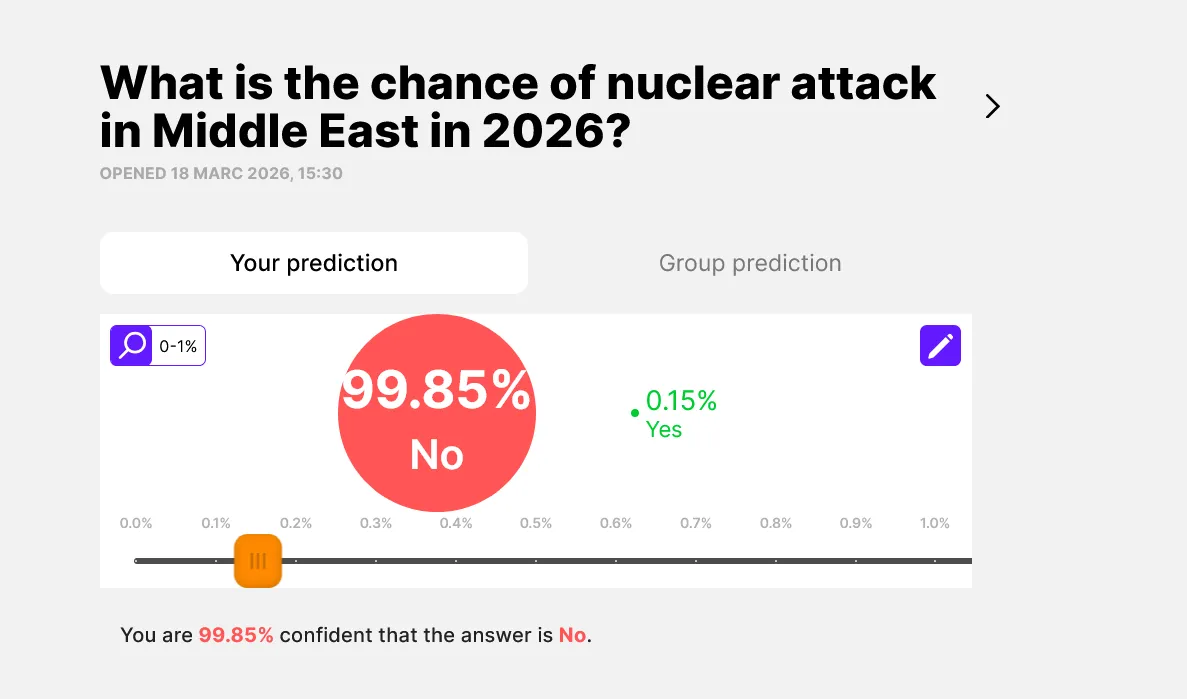
Since Confido is also used by organizations that specialize in very small risks, we now support the expression of such tiny probabilities.
How to use it
Each question card has a purple magnifying glass in its top left corner. Clicking it lets you choose whether to express your estimate on a 0-1%, 0-10%, 0-100%, 90-100%, or 99-100% scale.
New feature 4
Prediction history: see how the forecast got here
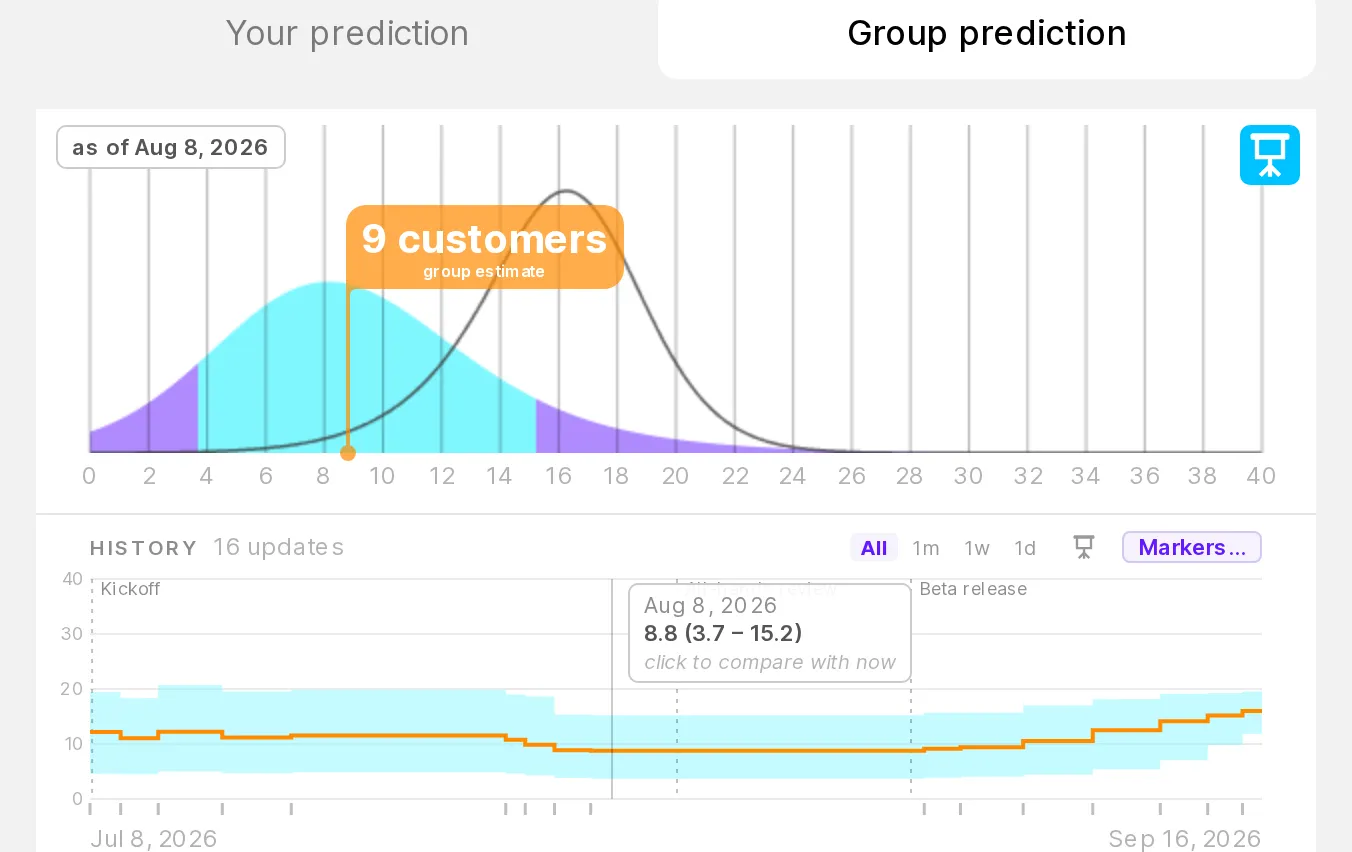
Every question now carries its history with it. Under the group prediction you get a timeline: the group’s median as a line, its 80% confidence range as a band, and named markers for events that mattered (“Kickoff”, “Beta release”). The current number tells you where the group stands; the timeline tells you whether that’s a stable consensus, a fresh reversal, or a slow drift — which is usually the more interesting question.
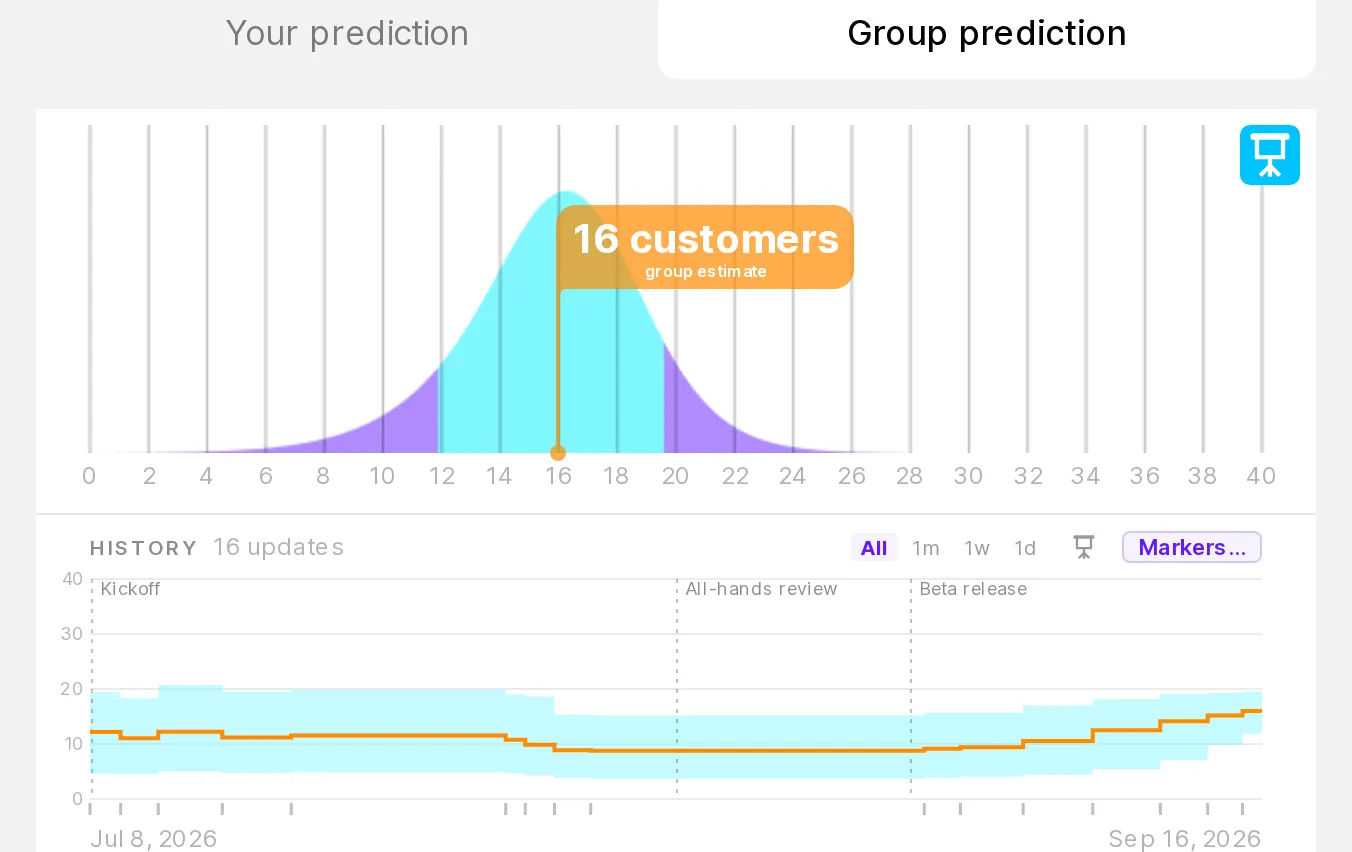
Hovering the timeline rewinds the whole graph: you see the full distribution as it was at that moment, with today’s outline behind it for reference.
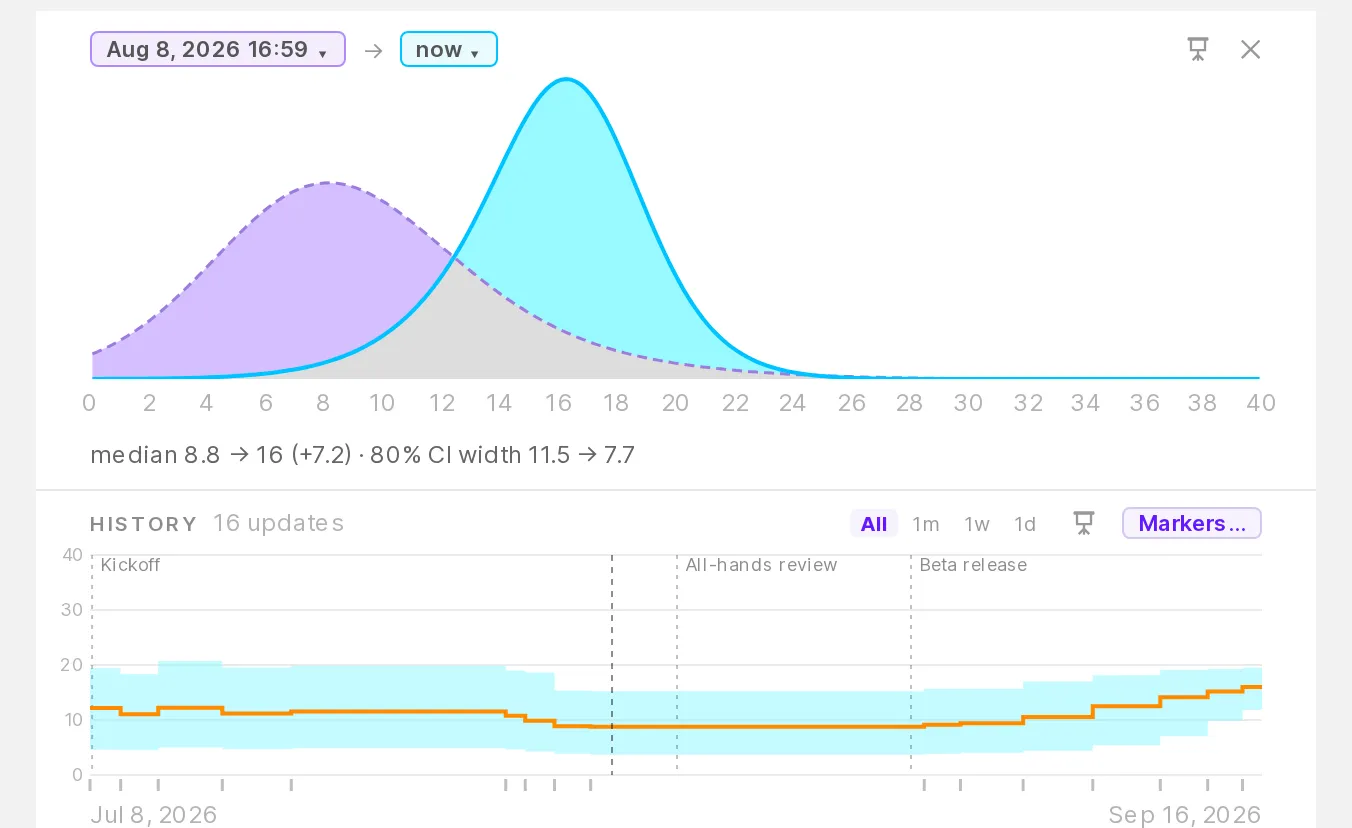
Clicking pins the moment and opens a comparison against now: what probability mass moved where, and how the median and confidence changed. You can also compare any two moments — say, the two sides of a marker.
How to use it
Open any question and switch to the Group prediction tab — the timeline sits under the graph once there are at least two updates.
- Rewind: hover anywhere on the timeline. Pin & compare: click; click the pin again (or press Escape) to release it. The two chips above the comparison are pickers — you can set either side to a marker, a typed date-time, or a point picked on the timeline.
- Zoom: drag to select a range, use the mouse wheel or pinch, or the All / 1m / 1w / 1d shortcuts.
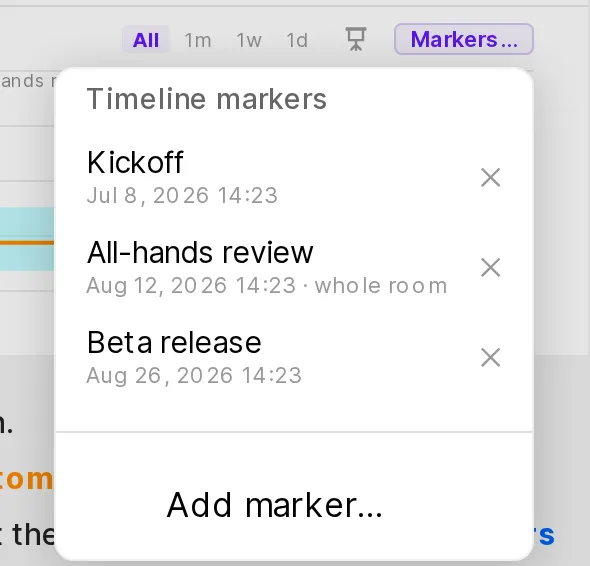
- Markers label real-world moments on the timeline. Anyone can jump to them via the Markers… menu; moderators can add and delete them there, for one question or for the whole room. When you have a moment pinned, creating a marker pre-fills that time.
Individual prediction changes between two moments (who moved, in which direction) are available in the comparison’s extra tabs — visible only to people who may see individual predictions anyway.
New feature 5
Import questions from a spreadsheet
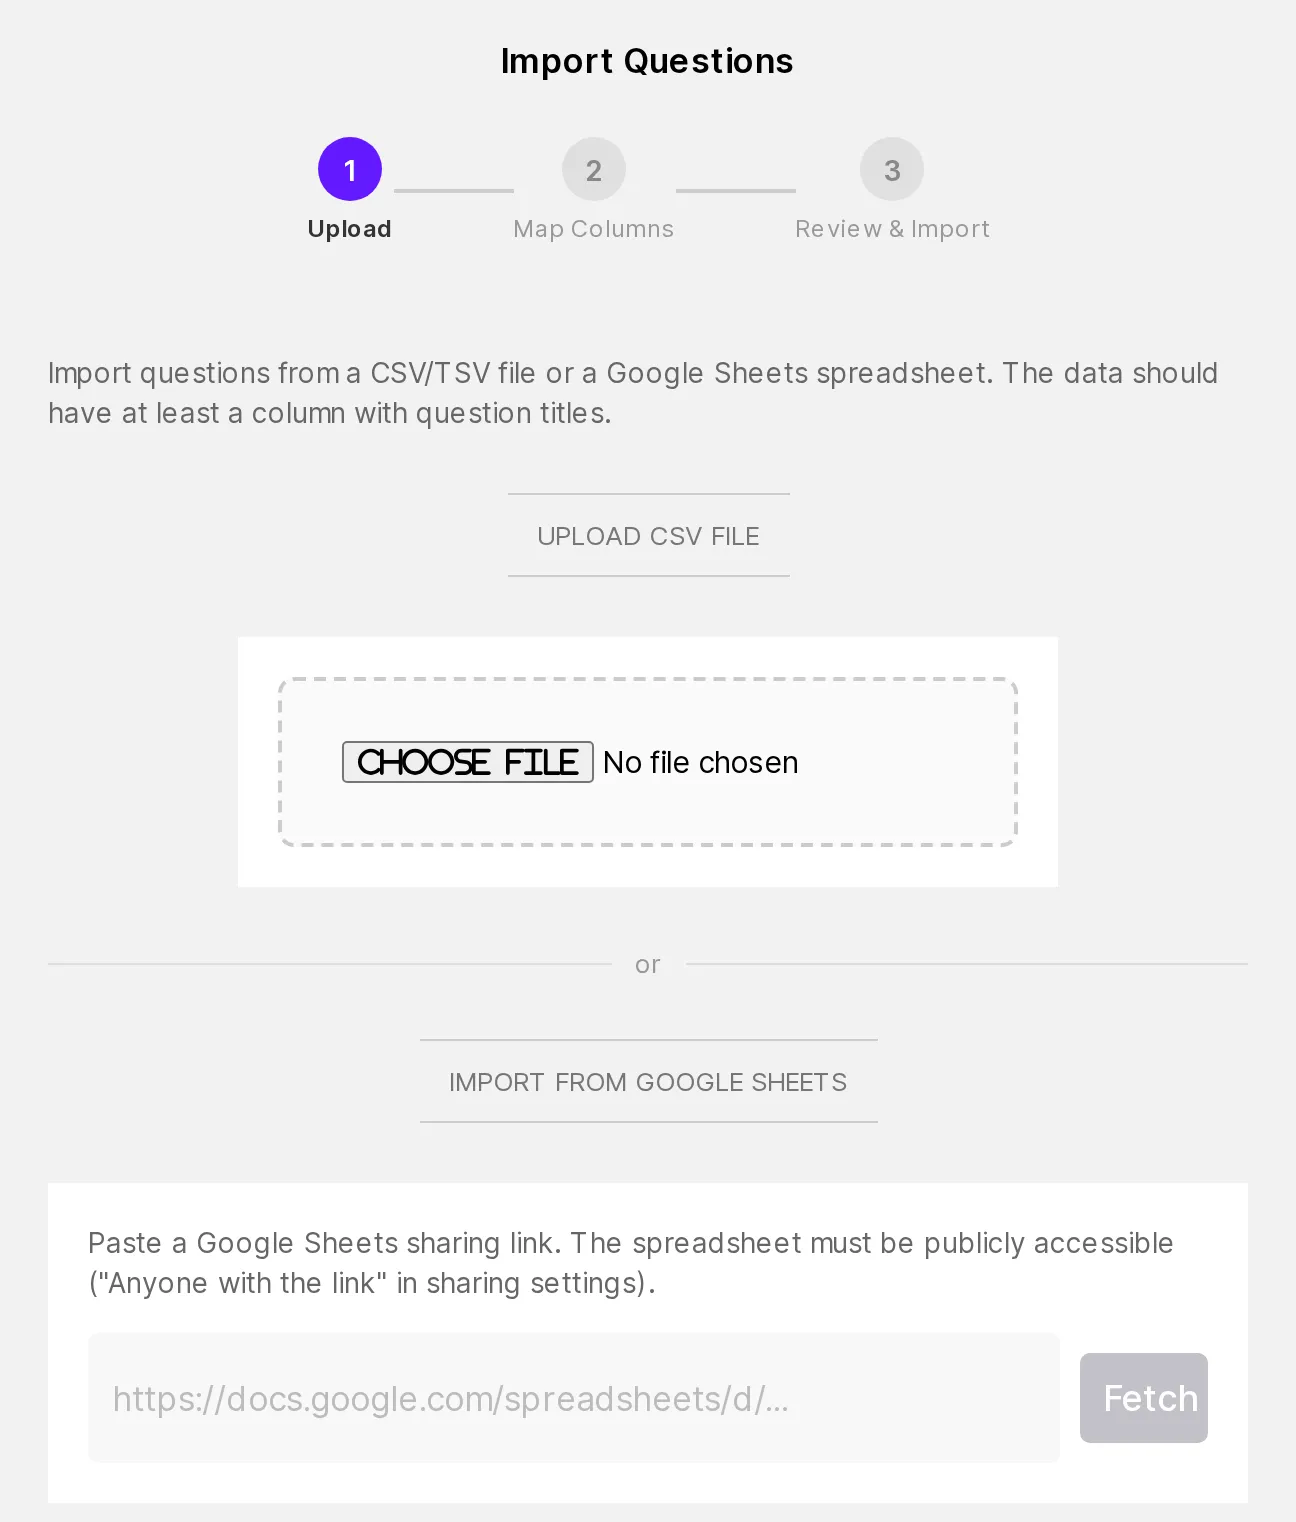
Questions are often drafted in a spreadsheet long before they reach a forecasting tool. The new import wizard takes a CSV/TSV file or a Google Sheets link, lets you map columns (title, description, type, ranges, tags), shows a review step, and creates everything in one go. If you map an ID column, re-running the import updates previously imported questions instead of duplicating them — handy when the spreadsheet stays the source of truth for a while.
How to use it
In a room where you can manage questions: Create a question → the import option at the top of the dialog (or /import on the room). The only required column is the question title. Tags in the sheet become question tags — which you can then filter by in the room’s toolbar, or use to ask several questions in one presentation step.
New feature 6
Scores, leaderboards, calibration
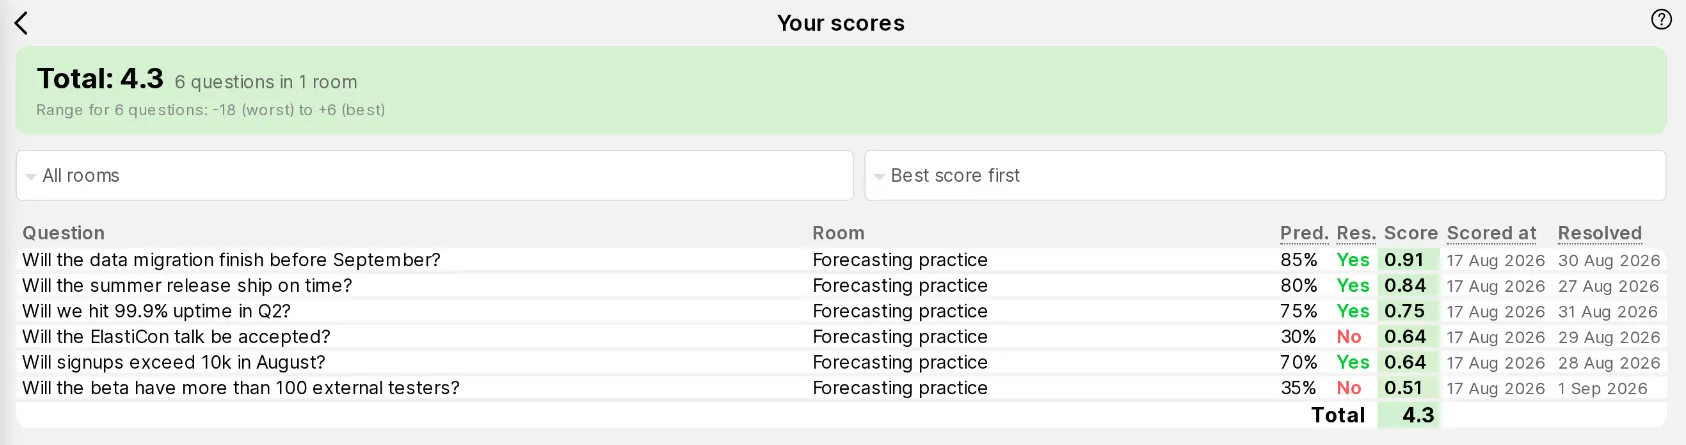
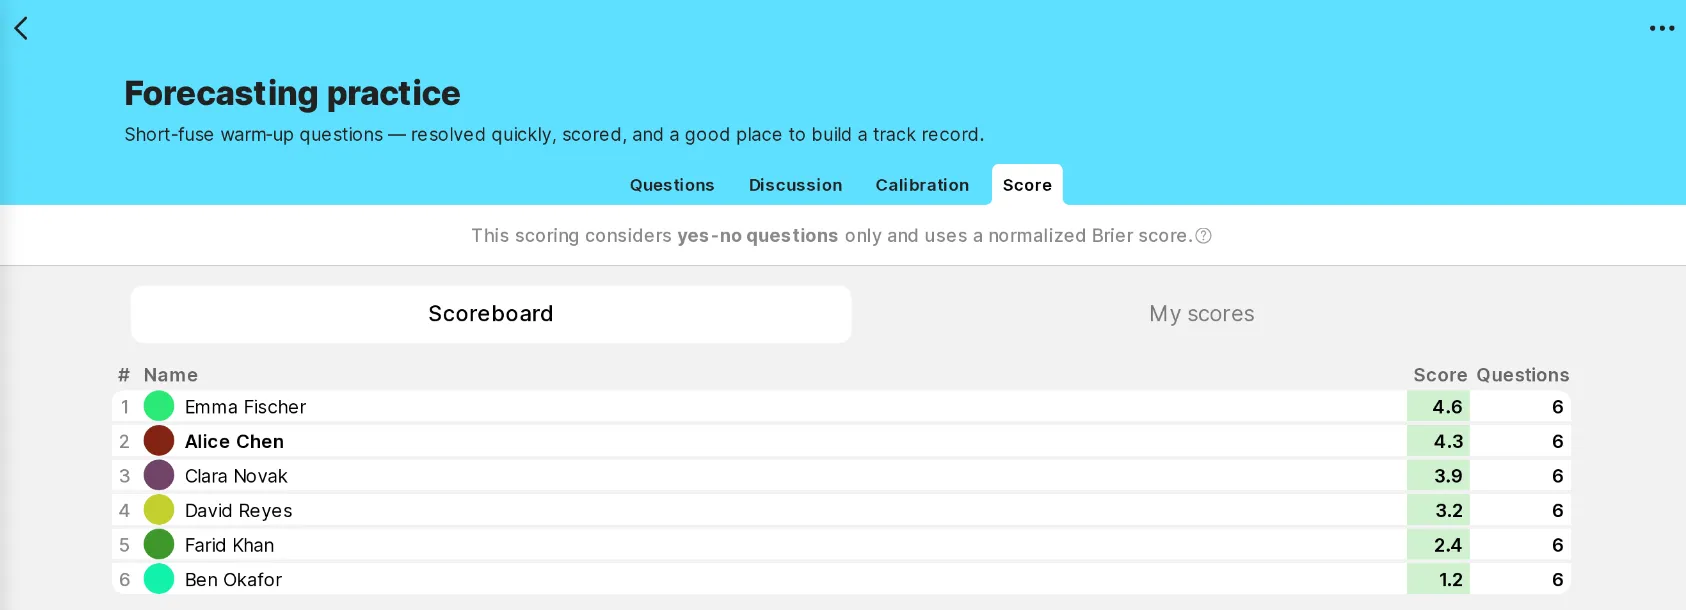
Resolved yes-no questions are scored (normalized Brier), and that finally has proper surfaces:
- Your scores (sidebar) — every scored prediction you’ve made, across rooms, with the questions behind it.
- A Score tab per room — a leaderboard plus your own rank. Rooms opt in via a scoring setting, and can require a minimum number of answered questions so nobody tops the board with one lucky guess.
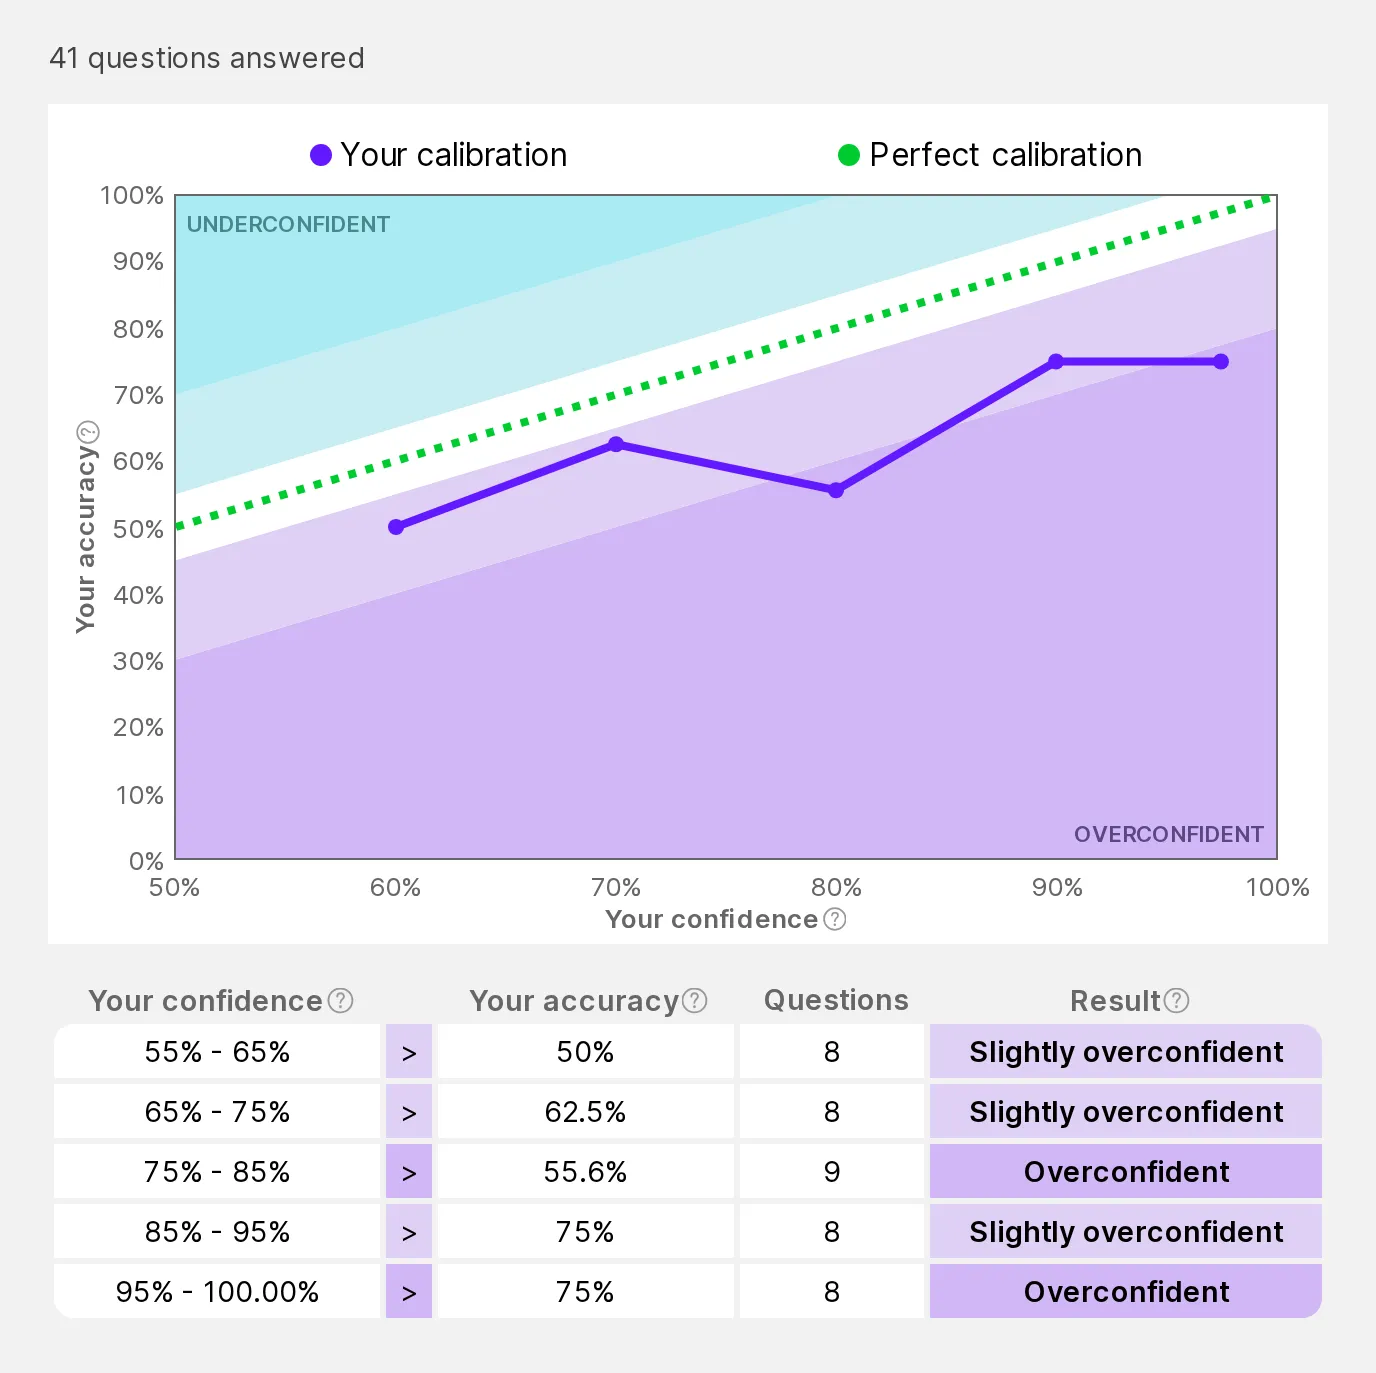
- Calibration stats — when you say 80%, how often are you right? Shown for you and for the group, workspace-wide and per room.
Thanks to these features, Confido is now also used to run forecasting tournaments. The software itself remains free, but we have found that large tournaments with dozens of participants tend to need ongoing consultations, custom technical adjustments, and similar help, which our organization provides as a paid service.
How to use it
Scoring needs two things on a question: a yes-no answer space and a resolution. Your latest prediction is what’s scored, unless the question has a score time in its schedule — then it’s your prediction as of that moment. Rooms enable the scoreboard in settings → scoring. Calibration stats live in the sidebar (Calibration stats) and per room in the Calibration tab; bins with too little data are left out rather than shown as noise.
See the guide to setting up scoring.
New feature 7
Integrated calibration exercise
Groups of people who try to estimate something together rarely start from the same place: some have years of practice at putting numbers on their uncertainty, while others have never been asked to say what “70% likely” should actually mean. To help close that gap, the public version of Confido now includes an integrated calibration exercise of about 180 binary questions, designed to give beginners quick, concrete feedback on how well their confidence matches reality, so that a group can start its real forecasting from a more even footing.
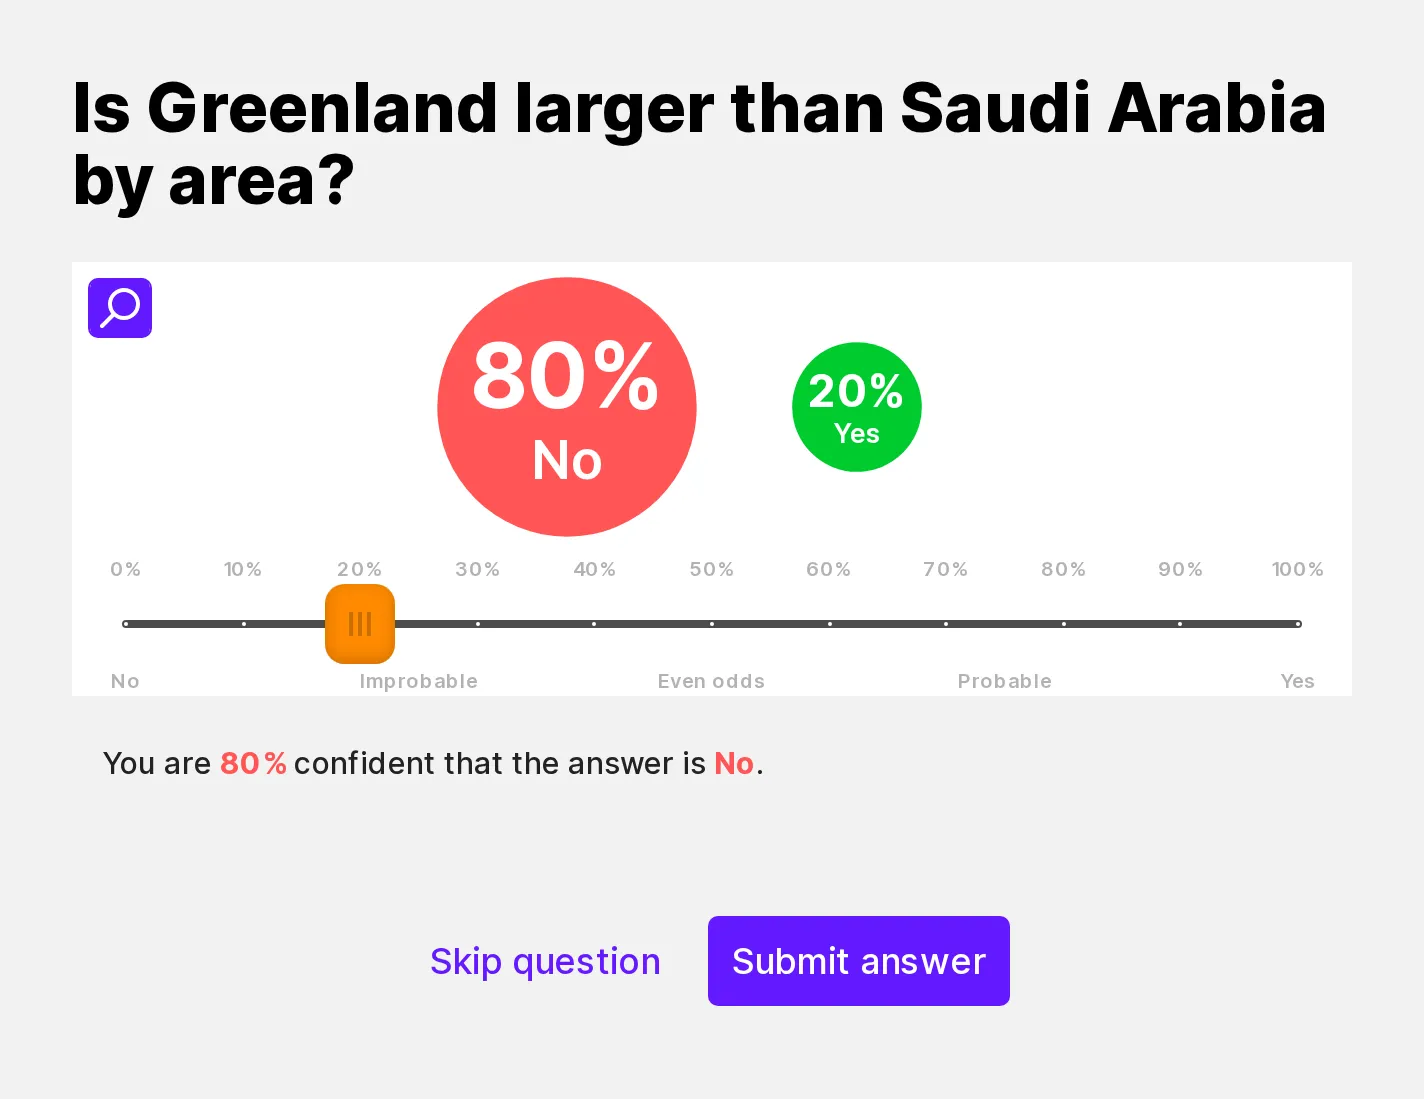
After each answer you see the correct one, a short explanation, and how you’re doing so far at that confidence level — a running score against the target (“at 75–85% you’ve been right 5 times out of 9; you should be around 80%”).
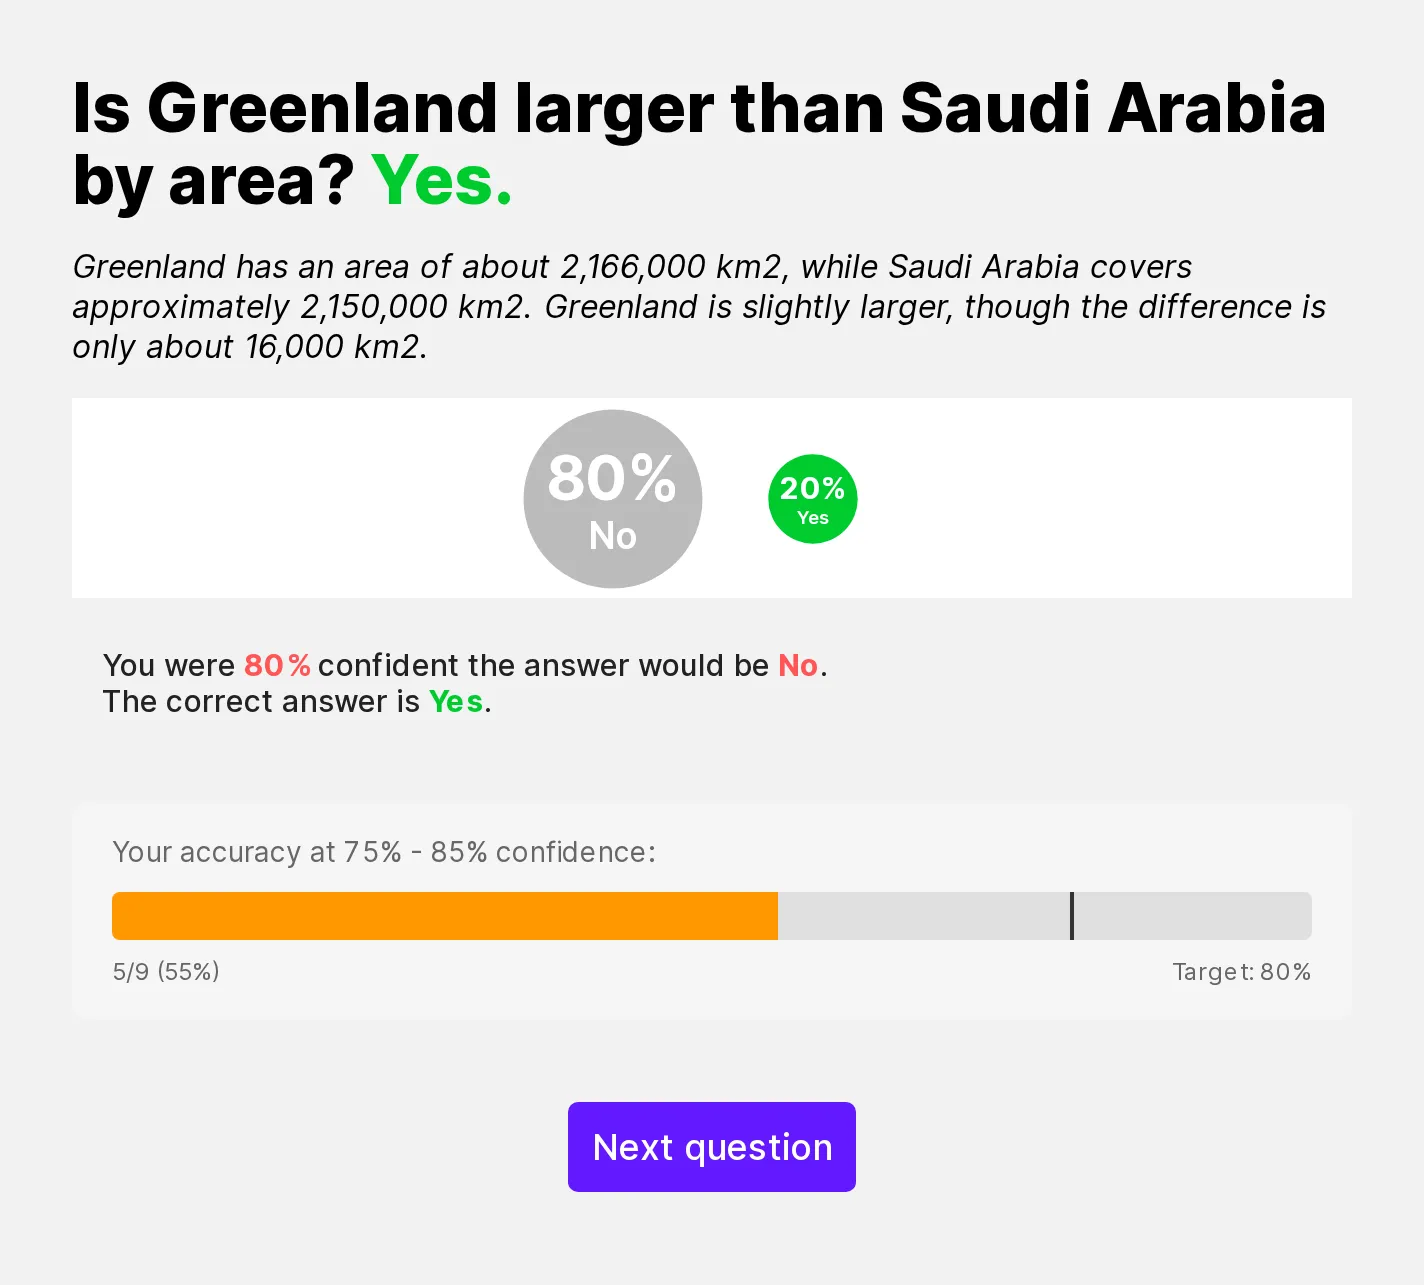
Your training stats use the same calibration chart as real questions, so the habits you practice here carry straight over. Most people discover the classic pattern quickly: fine at low confidence, too sure of themselves at 80–90%.
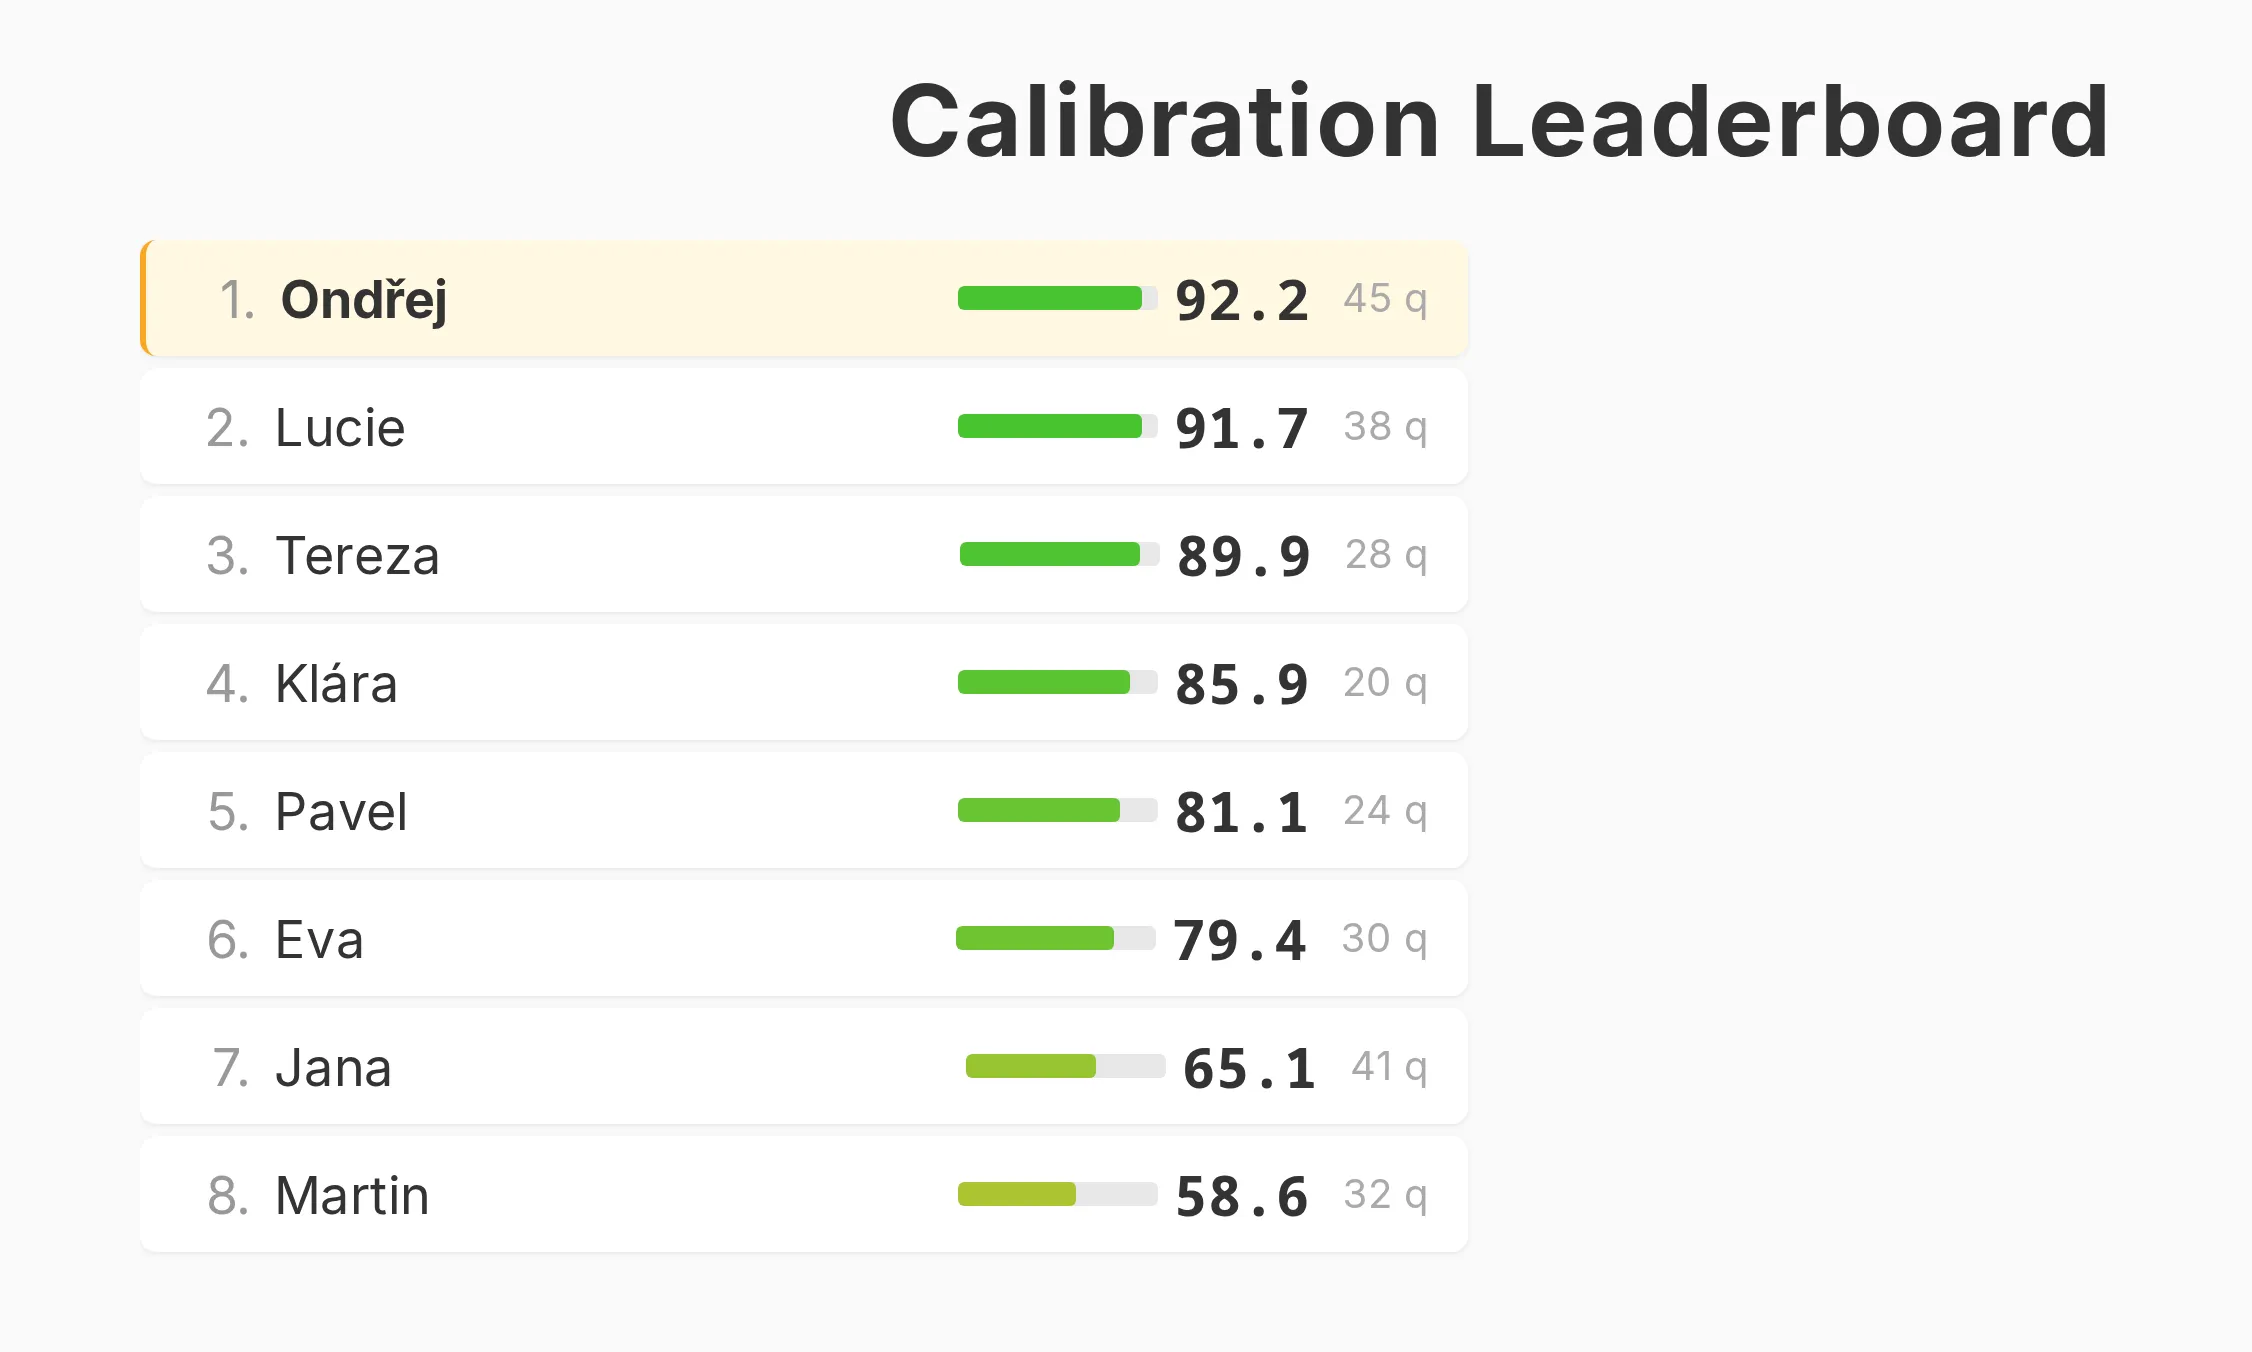
It also works as a group exercise — an icebreaker at the start of a workshop, or the warm-up before a forecasting session. A presentation step puts a live calibration leaderboard on the projector (best calibrated, not most knowledgeable, wins), and sends everyone following along to their own stats.
How to use it
Open Calibration training in the sidebar. Questions come in random order; you can skip any you’d rather not answer, and the Stats button shows your results so far.
Don’t look things up — the exercise only works with your own knowledge, reasoning, and gut feeling.
For a group session, add a Calibration training leaderboard step to the room’s presentation. Clicking a name on the projector shows that person’s calibration chart. Only people with at least ten answers are ranked.
The question set is a plain spreadsheet (question, answer, explanation, category) loaded by the server, so whoever runs your Confido instance can swap in questions tailored to your team.
See the guide to calibration training.
And more
Other features
We are also aware of demand for additional features (such as logarithmic scales), and we plan to add these to the public version once there is commercial demand.
In any case, if you have suggestions on how to improve our existing features and make them even more intuitive, we would greatly appreciate your ideas and feedback. The goal of Confido is to provide clear representations of probability and to develop an application that is so intuitive that even students and experts with no prior experience in forecasting can use it for communicating their uncertainty with ease.
In Confido, additional features were also developed that we believe are no longer as broadly applicable. We aim to keep this tool in the simplest and cleanest possible form for everyday users, so some of the developed features are rather kept hidden. If you would like to find out whether Confido might already support a specific function, please don’t hesitate to contact us at hello@confido.tools.